Pages

Thursday, August 8, 2019

The Water Cycle

AIM: TO LOOK AT THE WATER CYCLE AND HOW CLIMATE CHANGE IS AFFECTING IT.

Definition:
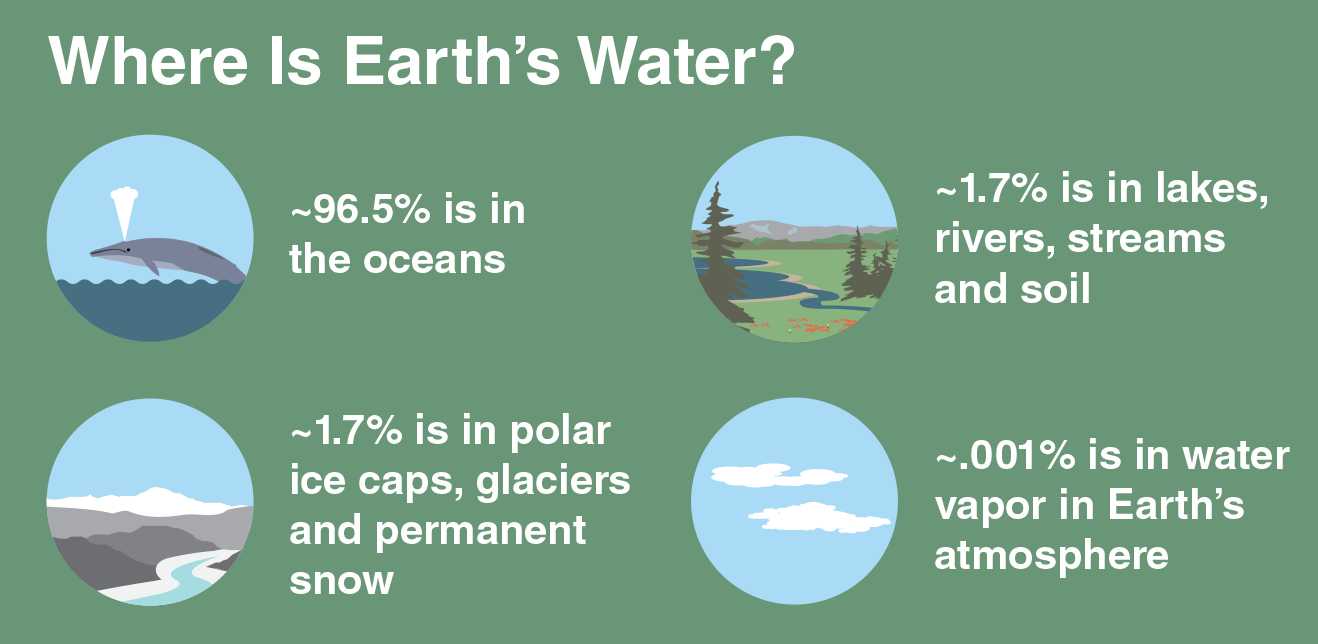


A green box with icons and white text. Text reads: Where is Earth's Water? 96.5 percent is in the oceans; 1.7 percent is in lakes, rivers, streams, and soil; 1.7 percent is in polar ice caps, glaciers, and permanent snow; 0.001 percent is in water vapor in Earth's atmosphere

Scientific words:


  • Evaporation. When water is heated by radiant energy it turns into water vapor.
  • Transpiration. Evaporation from plants.
  • Condensation. When water vapor cools, molecules join together and form clouds.
  • Precipitation. When clouds get heavy the waters falls as rain, sleet, hail, or snow.
  • Acidification: the action or process of making or becoming acidic.

We will be conducting an experiment that looks at the different ways that climate change is affecting the water cycle.
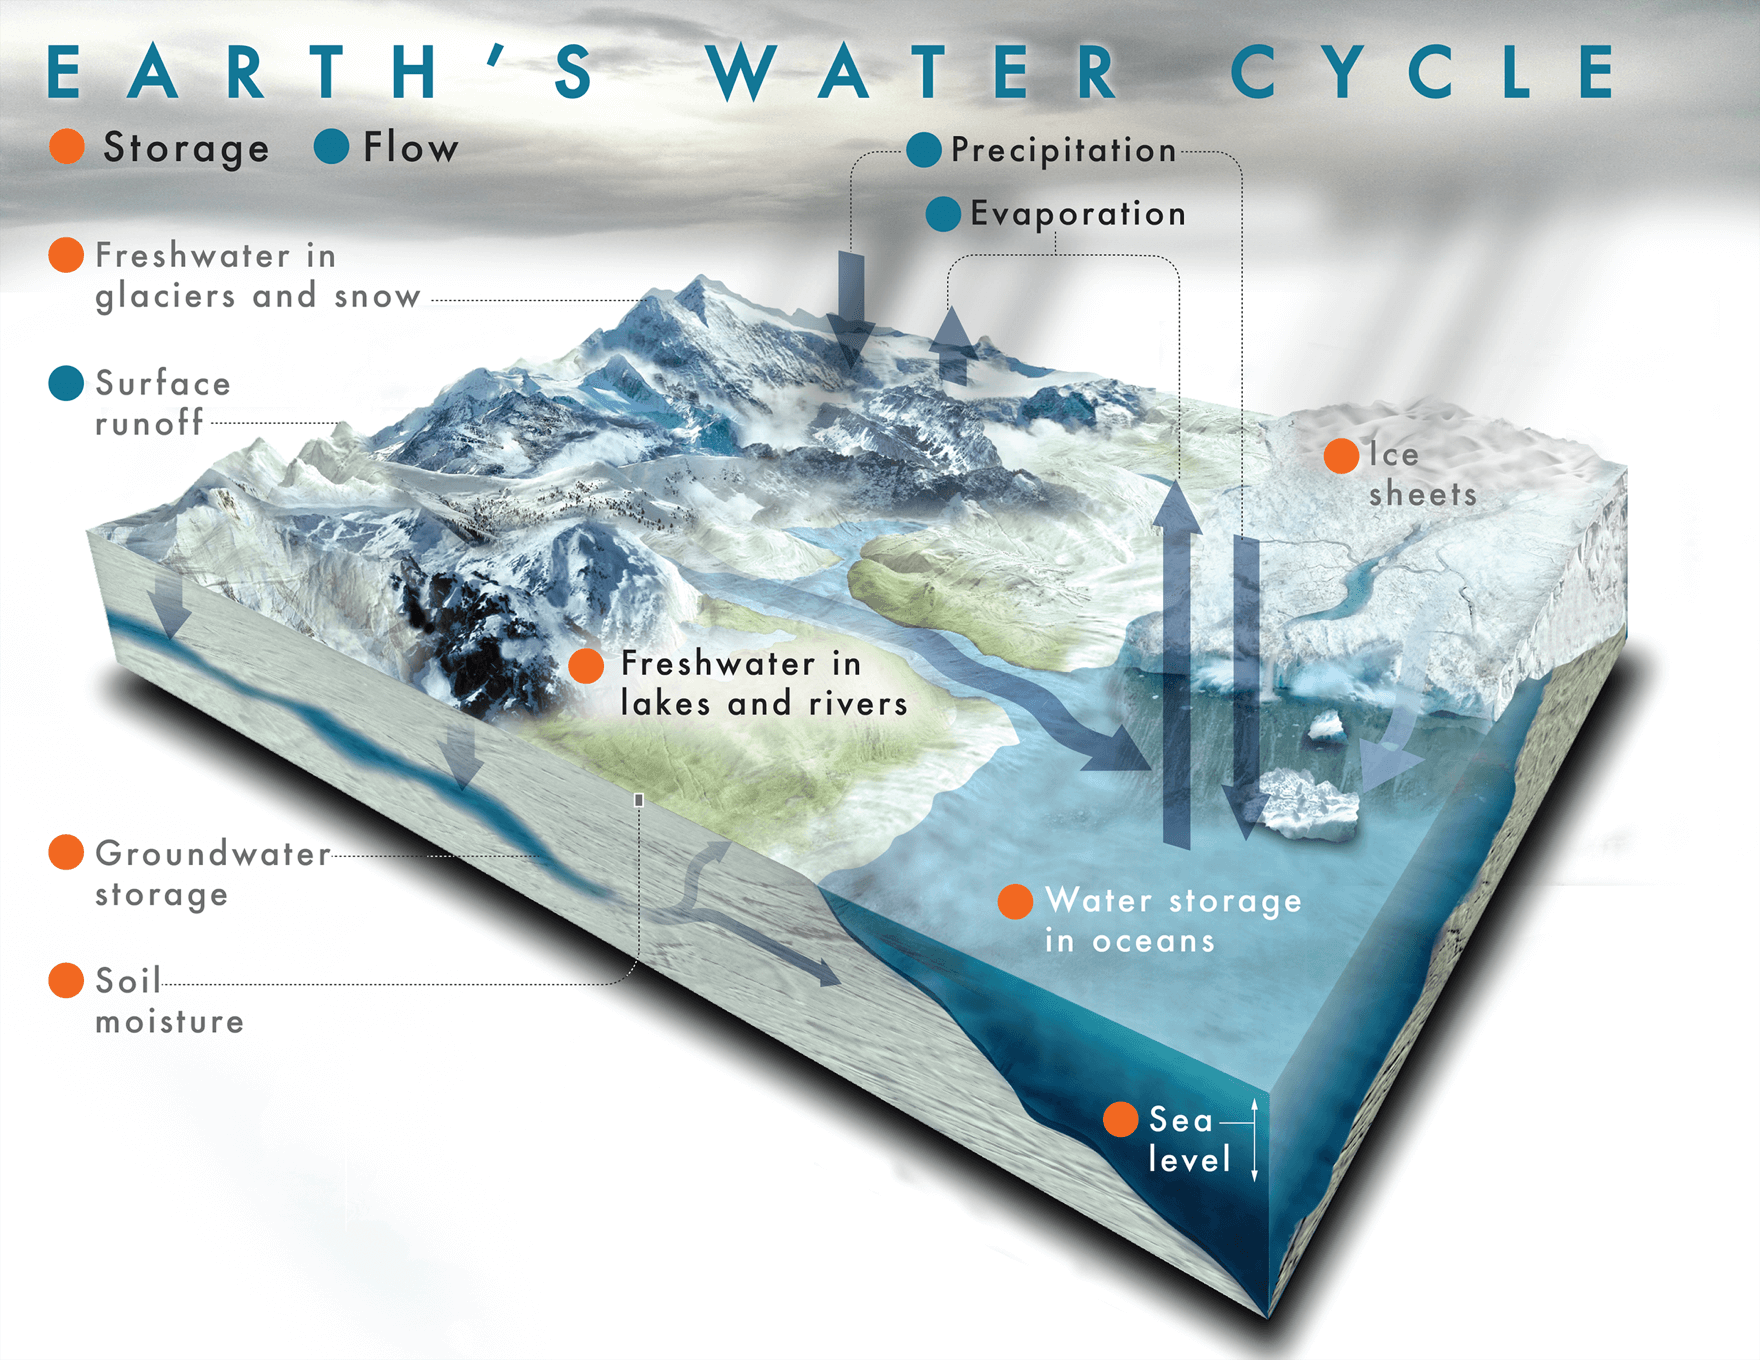
An illustration of the water cycle showing how water travels from rivers and streams to clouds to snow and back again

THE WATER CYCLE EXPERIMENT

Bag 1: Normal Water cycle
Bag 2: Water cycle with CO2 added: like Oceans in climate change
Bag 3: Water cycle with ice added: like Antarctica in climate change

Material:

  1. Bag
  2. Pen
  3. Water
  4. 2 drops of food colouring
  5. Litmus paper
  6. Soda

Steps:

  1.  Get into a group
  2.  Get your materials 
  3.  Draw the cycle on your bag
  4.  Put a cup of water/soda in a bag
  5. Put in 2 drops of food colouring in the bag.

Two Images:


Findings:


The Water Cycle: Bag 1
CO2 Water Cycle: Bag 2
Acid
Desert Water Cycle
Bag 3
Does it cycle?
Yes.Yes.Yes
Amount of Water
222
Acidity
121

Key: Water and acidity amount: 1 = none 
2 = small drips
3 = large drips

Other comments:

  1. Bag 1 has no acidity.
  2. Bag 1 has small drips of water.
  3. Bag 1 still cycles.
  4. Bag 2 has soda instead of water in it.
  5. Bag 2 has a small drip amount of acidity. 
  6. Bag 2 has small drips amount of water.
  7. Bag 3 has sand instead of water or soda.
  8. Bag 3 has no acidity.
  9. Bag 3 has small drips amount of water in it. 

Conclusion:

Bag 1, 2 and 3 all had small drips amount of water. Bag 1 and 3 and no acidity in its cycle. All of the bags water cycles were working. 


1. Ice cap melt
- Definition: A polar ice cap is a region in the North and or South pole and that is a planet covered in ice. While the Ice caps melt sea levels rise and the oceans become less containable.
- 2 Pictures:
 Image result for Ice cap melt

Image result for Ice cap melt

- How it affects climate change?
The changes in the amount of the sea's ice cap can disrupt regular circulation, there by leading to changes in the global climate. Even a small increase in temperature also can lead to warming over time. Which means the polar regions are the most sensitive to climate change on Earth.


2. Acidification
- Definition: Ocean acidification is the on going decrease in the pH of the Earths oceans. This is caused by taking up the carbon dioxide from the atmosphere. Sea water is a slight basic meaning of pH > 7, and the ocean acidification involves a shift towards pH neutral conditions rather than changing to acidic conditions.
- 2 Pictures
Image result for acidification

Image result for acidification
- How it affects climate change?
As us humans keep burning more fossil fuels the focus on the carbon dioxide in our atmosphere keeps continuing to rise. Which is making climate change make both air and sea temperatures get hotter and hotter. 

3. Deforestation
- Definition: 
- 2 Pictures:
Image result for deforestation

Image result for deforestation

- How it affects climate change?

4. Water Vapour
- Definition: 
- 2 Pictures:
- How it affects climate change?


Conclusion:

In this one we started with Precipitation. precipitation comes from evaporation. Precipitation is a big word for rain. Then we went out to Storms and Hurricanes. Sometimes rain can create storms and hurricanes that is why we put it there. Then we moved to Flooding because flooding can be caused by Hurricanes and Storms. Next is oceans because when there is a flood it can lead to the ocean. We did evaporation next because the sun will evaporate some of the flooding. We linked freshwater to evaporation because the heat can evaporate the salt from salty water then it will become fresh. After fresh water we did water vapour because water vapour is basically clean water. Back to Evaporation we linked off to another part and that's condensation because when something gets evaporated it leaves condensation behind. After condensation we did Carbon Dioxide because when you breathe out your breathing out Carbon Dioxide and it sometimes create moisture which it condensation. 


Draw a labelled diagram of the Water Cycle

Water cycle words:
  1. Precipitation: Precipitation is a big science word for rain. When water is evaporated it goes into the clouds and comes out as rain. 
  2. Hurricanes: Hurricanes are most likely to happen in the warmth of the water and it will just keep going till it dies out.
  3. Storms: Storms can be a big threat to our earth because it may get to dangerous and it can seriously hurt people. 
  4. Evaporation: Evaporation is when there is water and the sun will evaporate it. It will then go into the clouds and it comes out as rain. 
  5. Carbon Dioxide: When you breathe out your breathing out carbon dioxide. You breathe in Oxygen and it comes out Carbon Dioxide.
  6. Water: Water helps us survive. We get to drink it, swim in it and etc. 
  7. Oceans: Our Oceans are a home for heaps of our sea life. Our earth needs the oceans because without it our earth will be dried out. 
  8. Water vapour: Water vapour is a gas form. It can be formed from a boiling liquid and or ice. 
  9. Freshwater: Fresh water can include ice sheets, ice gaps, glaciers, ice bergs, bogs, ponds, lakes, rivers and streams.
  10. Flooding: Flooding can be a part of climate change. The ice is melting so it can create floods then the water levels will rise. 
SOLO Hexagons Activity

Water cycle words:

  1. Precipitation
  2. Hurricanes
  3. Storms
  4. Evaporation
  5. Carbon Dioxide
  6. Water
  7. Oceans
  8. Water vapour
  9. Freshwater
  10. Flooding


Weather - Science Hurumanu

Weather and Climate Change 

Measuring weather.

Wind

Beaufort
Force
Wind Speed
(KPH)
SpinsIndicatorsTerms Used in NWS Forecasts
00-20Calm; smoke rises vertically.Calm
12-510Shown by direction of wind smoke drift, but not by wind vanes.Light
26-1240Wind felt on face, leaves rustle; ordinary vanes moved by wind.Light
313-2080 Leaves and small twigs in constant motion; wind extends light flag.Gentle
421-29130Raises dust and loose paper; small branches are moved.Moderate
530-39190Small trees in leaf begin to sway; crested wavelets form on inland waters.Fresh
640-50250Large branches in motion; whistling heard in telephone wires; umbrellas used with difficulty.Strong
751-61320Whole trees in motion; inconvenience felt walking against the wind.Strong
862-74390Breaks twigs off trees; generally impedes progress.Gale
975-87470Slight structural damage.Gale
1088-101550Seldom experienced inland; trees uprooted; considerable structural damage occurs.Whole gale
11102-116640Very rarely experienced inland; accompanied by widespread damage.Whole gale
12117 or more730+Very rarely experienced; accompanied by widespread damage.Hurricane

Wind speed - Making an anemometer.

Anemometer

MATERIALS

  1. Straws  (x4)
  2. Pencil
  3.   Pin
  4. Cups (x4)
  5.   Tape

STEPS

  1.   Get materials
  2.   Make the straws into a cross and put a pin in it.
  3.   Put the pinned straws into the top of a pencil with a eraser on top.
  4.   Then tape the straws so it stays as its cross.
  5.   Add the cups on the straws.
  6.  Make the cups the same way so when the wind hits it it will grab the air and spin.
Once you have made an anemometer we are going to record the wind speed.

Group size: 5

You will need:

Anemometer (above) 

Roles:


  • Timekeeper
  • Counter
  • Recorder
  • Anemometer Manager
  • Wind generator
  1. Mount the anemometer in a place that has full access to the wind from all directions.
  2. When the time keeper says "Go", the counter in each group will count how many times the marked cup passes them in one minute and write it down.
  3. If possible, repeat the above step four (4) times and record the average number of spins on the chart.

FINDINGS

  • Record how many times it spins using the table below.
You will need to create the wind yourself by blowing. Get 4 different wind speeds by blowing.

You will need to time them and count the number of spins.

Time IntervalNumber of Spins
1.10s1 1/3
2.10s1 1/2
3.10s4 1/4
4.10s4 1/4
  • Can you make a statement connecting the number of spins of your anemometer and the speed of the wind? 
for our first two tries they were a lot slower because there was no wind inside to make it go faster. For our other two tries we went outside and there was wind so it was a lot stronger.

CONCLUSION:

When we were testing the anemometer it worked better outside because there was wind but no wind inside. 

Science Hurumanu - Biomass

RENEWABLE ENERGY

Aim: To compare the amount of gas that is produced from different types of biomass.

Material:
  1.   Bottles (x3)
  2.   Permanent marker
  3.   Disposable gloves
  4.   Cup
  5.   Fresh horse manure
  6.   Mashed banana
  7.   Funnel
  8.   Water
  9.   Balloons (x3)
  10.   Vegetable peelings.
Steps:


  1.   Take off the label for all 3 bottles
  2.   Label each bottle. (Horse Manure, Horse Manure and Mashed Banana, Horse Manure and Vegetable Peelings.
  3.  Place 1 cup of Manure in each bottle. 
  4.  Place 1 cup of Vegetable peelings in 1 bottle.
  5.  Place 1 mashed Banana in the bottle.
  6.   Fill each bottle with water.
  7.  Put a balloon on top


A picture of three bottles with balloons on top, containing cow manure with vegetable peelings or mashed banana.
Energy science project


Investigation.


Research the following Biomass fuels. You will need to:

Write a definition of the fuel.
Write 8 sentences about the fuel. 
  • How is it made? 
  • Where is it made? 
  • What is it made with? 
  • What countries use it? 
  • What uses will it have in the future?  
Place 1 image of the fuel.

Biomass Fuel types.

Name: Agricultural crops and wood fuels.
Definition: 
Agricultural crops such as miscanthus and straw from cereal crops can be used as fuel for production of heat. Herbaceous material has a different composition from wood and its combustion must be handled with different wood

Research: 
Wood Biomass is the main source of wood energy in New Zealand. It comes in a number of different forms like Firewood, shavings, sawdust, wood chips, agricultural crops and bark.

Uses: you can use it for wood for the fire or paper because wood chips are made out off paper. 
Image:
Image result for definition of Agricultural crops and wood fuels.


Name: Animal waste.
Definition: Animal waste has another name called Manure. Manure is a organic matter, mostly derived animal feces. 


Research: Animal waste are commonly considered the excreted materials from living animals. Under certain conditions, the waste may include straw, hay, wood, shavings and or other organic debris.

Uses: Animals waste can be used for a gardening fertiliser. 
Image: Image result for horse waste

Name: Bio gas
Definition: Bio gas is the mixture of gases produced by the breakdown of organic matter in the absence of oxygen.

Research: Bio gas can be made from raw materials like Agricultural waste, manure, plant material, sewage, green or food waste. 

Uses: Bio gas methane, hydrogen and carbon monoxide can be combusted or combined with oxygen. This type of energy releases bio gas to be used as a fuel. it can be used for any type of heating like cooking.  

Image: Image result for what is biogas used for

Name: Bio fuels
Definition: A bio fuel is a type of fuel that is produced through contemporary processes from biomass. 

rather than a fuel produced by the very slow geological processes involved in the formation of fossil fuels, such as oil.
Research: Rather than a fuel produced by the way slow geological processes involved in the formation from fossil fuels, such as oil.

Uses: Biofuels can be a transportation fuels like ethanol and bio diesel that are made from biomass materials.

Image:
Image result for what is biofuels used for